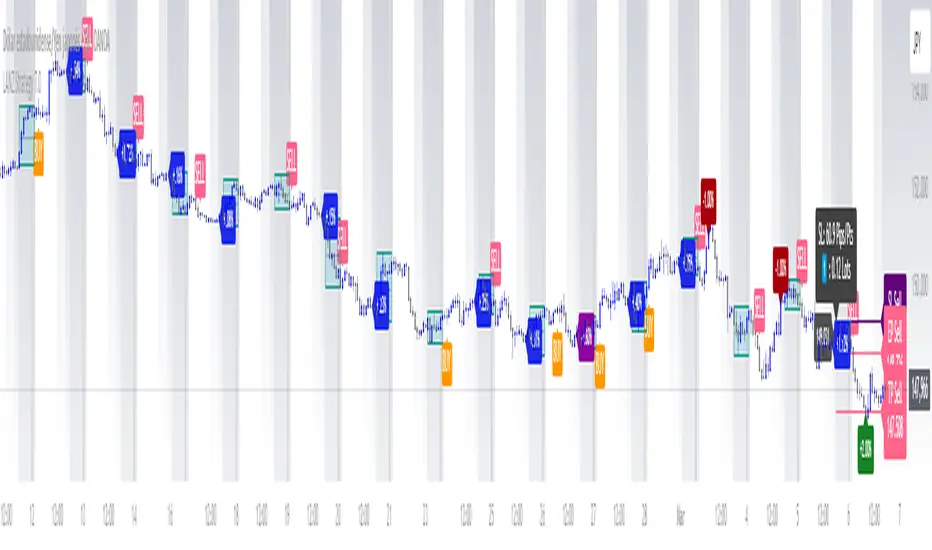
LANZ Strategy 7.0🔷 LANZ Strategy 7.0 — Multi-Session Breakout Logic with Midnight-Cross Support, Dynamic SL/TP, Multi-Account Lot Sizing & Real-Time Visual Tracking
LANZ Strategy 7.0 is a robust, visually-driven trading indicator designed to capture high-probability breakouts from a customizable market session.
It includes full support for sessions that cross midnight, dynamic calculation of Entry Price (EP), Stop Loss (SL) and Take Profit (TP) levels, and a multi-account lot sizing panel for precise risk management.
The system is built to only trigger one trade per day and manages the full trade lifecycle with automated visual cleanup and detailed alerts.
📌 This is an indicator, not a strategy — it does not place trades automatically, but provides exact entry setups, SL/TP levels, risk-based lot size guidance, and real-time alerts for execution.
🧠 Core Logic & Features
🚀 Entry Signal (BUY/SELL)
The trading day begins with a Decision Session (yellow box) where the high/low range is recorded.
Once the Operative Session starts (blue zone), the first touch of the session’s high triggers a BUY setup, and the first touch of the session’s low triggers a SELL setup.
Only one valid trade can be triggered per day — the system locks after the first signal.
⚙️ Dynamic Stop Loss & Take Profit
SL levels are derived from the Decision Session high/low using customizable Fibonacci multipliers (independent for BUY and SELL).
TP is dynamically calculated from the EP–SL distance using a user-defined Risk:Reward ratio (R:R).
All EP, SL, and TP levels are drawn as independent lines with customizable colors, label text size, and style.
⏳ Session & Midnight-Cross Support
Works with any custom Decision/Operative session hours, including sessions that start one day and end the next.
Properly tracks time zones using New York session time for consistency.
Includes Cutoff Time: after this limit, no new entries are allowed, and all visuals are auto-cleared if no trade was triggered.
💰 Multi-Account Risk-Based Lot Sizing
Supports up to 5 independent accounts.
Each account can have:
Own capital
Own risk percentage per trade
Lot size is auto-calculated based on:
SL distance (in pips or points)
Pip value (auto-detected for Forex or manually set for indices/commodities)
Results are displayed in a clean lot size info panel.
🖼️ Real-Time Visual Tracking
Dynamic updates to all levels during the Decision Session.
EP, SL, TP lines update if the session high/low changes before the Operative Session starts.
Trade result labels:
SL hit → “–1.00%” in red
TP hit → “+X.XX%” in green
Manual close at Operative End → shows actual % result in blue or purple.
🔔 Alerts for Every Key Event
Session start notification
EP entry triggered
SL or TP hit
Manual close at session end
Missed entry due to cutoff
🧭 Execution Flow
Decision Session (Yellow) — Capture high/low range.
Operative Session (Blue) — First touch of high = BUY setup; first touch of low = SELL setup.
Plot EP, SL, TP lines + calculate lot sizes for all active accounts.
Track trade until SL, TP, or Operative End.
If no entry triggered by Cutoff Time → clean all visuals and notify.
💡 Ideal For:
Traders who operate breakout logic on specific sessions (NY, London, Asian, or custom).
Those managing multiple accounts with strict risk per trade.
Anyone trading assets with sessions crossing midnight.
👨💻 Credits:
Developer: LANZ
Logic Design: LANZ
Built For: Multi-timeframe session breakouts with high precision.
Purpose: One-shot trade per day, risk consistency, and total visual clarity.
ابحث في النصوص البرمجية عن "session high"
PipsHunters Trading ChecklistTitle: PipsHunters Trading Checklist (PHTC)
Short Description / Teaser:
Enforce trading discipline and never miss a step in your pre-trade analysis with this simple, interactive, on-chart checklist.
Full Description:
🚀 Overview
The PipsHunters Trading Checklist (PHTC) is a powerful yet simple tool designed to instill discipline and structure into your trading routine. In the heat of the moment, it's easy to forget crucial steps of your analysis, leading to impulsive and low-probability trades. This indicator acts as your personal co-pilot, providing a persistent, on-chart checklist that you must manually complete before taking a trade.
This is not an automated signal generator. It is a utility to keep you accountable to your own trading plan. The checklist items are inspired by common concepts in price action and Smart Money Concepts (SMC) methodologies, but they serve any trader who follows a rule-based system.
✨ Key Features
Interactive On-Chart Table: Displays a clean, non-intrusive table directly on your chart.
Manual Check-off System: You are in full control. Go into the indicator settings and check off each item as you complete your analysis.
Real-Time Progress Tracking: The table header shows your progress (e.g., 4/7) and changes color from red to green when all items are checked.
Clear Visual Cues: Each item is marked with a ✅ or ❌, and the text color changes to provide an at-a-glance status.
"Ready!" Status: A final "READY!" confirmation appears once your entire checklist is complete, giving you the green light to look for an entry based on your strategy.
Fully Customizable Position: Place the table in any corner of your chart (Top Left, Top Right, Bottom Left, Bottom Right) to suit your layout.
📋 The Checklist Items Explained
The default checklist guides you through a structured, top-down analysis process common in many trading strategies:
Seat before 1H: A reminder to be settled and mentally prepared at your desk at least an hour before your target session begins. Avoids rushing and emotional decisions.
Check News: Have you checked for high-impact news events that could introduce extreme volatility and invalidate your setup?
Mark Day Open: The daily open is a key institutional level. Marking it helps establish the daily bias.
Mark LQ Levels: Have you identified key Liquidity (LQ) levels? This includes previous day/week highs and lows, session highs/lows, and other obvious swing points.
Wait for Kill Zone: A reminder to be patient and wait for price to trade into a specific, high-probability time window (e.g., London Kill Zone, New York Kill Zone).
LQ sweep inside Kill Zone: The core of the setup. Has price swept a key liquidity level within your chosen Kill Zone?
Lower TF Confirmations: After the liquidity sweep, have you waited for confirmation on a lower timeframe? This is often a Market Structure Shift (MSS) or Change of Character (CHoCH).
🛠️ How to Use
Add the "PipsHunters Trading Checklist" indicator to your chart.
Go to the indicator's Settings (click the gear icon ⚙️).
As you perform each step of your pre-trade analysis, tick the corresponding checkbox in the Inputs tab.
The on-chart table will update instantly to reflect your progress.
Only when all 7 items are checked will the table signal "READY!".
🎯 Who Is This For?
This indicator is perfect for:
SMC / ICT Traders: The checklist items align directly with Smart Money Concepts.
New Traders: Helps build the essential habit of a consistent pre-trade routine.
Inconsistent Traders: Acts as a guardrail to prevent impulsive, undisciplined entries.
Any Rule-Based Trader: Anyone who follows a trading plan can benefit from the structure it provides.
Disclaimer: This is a utility tool to aid in discipline and execution. It does not provide financial advice or guarantee profitable trades. All trading involves risk, and you are solely responsible for your own decisions. Trade safe and stay disciplined!

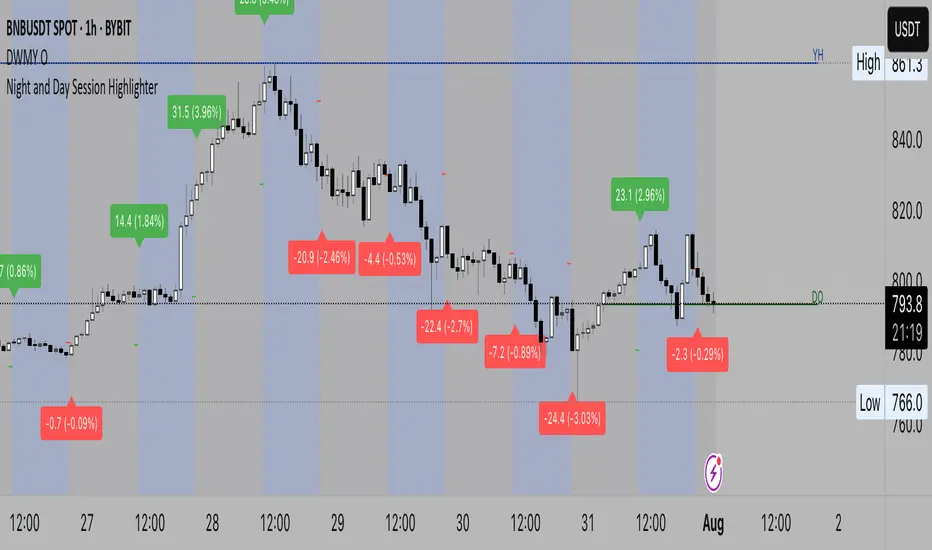
Night and Day Session Highlighter % (Valehson)- This script splits the day into night and day sessions and displays the price change in percentage.
- Этот скрипт разделяет день на вечерние и дневные сессии и показывает изменение цены в процентах.
Liquidity Grab Detector (Stop Hunt Sniper) v2.2📌 Purpose
This indicator detects Stop Hunts (Liquidity Grabs) — false breakouts above/below recent highs or lows — filtered by trend direction, volatility, and volume conditions.
It is designed for scalpers and intraday traders who want to identify high-probability reversal zones.
🧠 How It Works
1. Key Logic
Detects previous swing high / swing low over the Lookback Bars.
Marks a false breakout when price moves beyond the level and closes back inside.
Requires a volume spike on the breakout to confirm liquidity sweep.
2. Trend Filter (EMA 50)
Bullish signals only if price is above EMA 50.
Bearish signals only if price is below EMA 50.
This removes most counter-trend stop hunts.
3. ADX Filter
Signals appear only when ADX < Max ADX (low-trend conditions).
This avoids false signals in strong trending markets.
📈 How to Use
Green Arrows: Bullish stop hunt (potential long entry).
Red Arrows: Bearish stop hunt (potential short entry).
Works best in range conditions, liquidity zones, or near session highs/lows.
Combine with order flow, volume profile, or price action for extra confirmation.
Recommended Timeframes: 1m–15m for scalping; 30m–1h for intraday.
Markets: Crypto, Forex, Indices.
⚙️ Inputs
Lookback Bars — swing detection
Volume Spike Multiplier
EMA Length (trend filter)
Min Retrace — how much price must return inside range
Max ADX — trend filter sensitivity
⚠️ Disclaimer
This script is for educational purposes only and does not constitute financial advice.
Always test thoroughly before live trading.

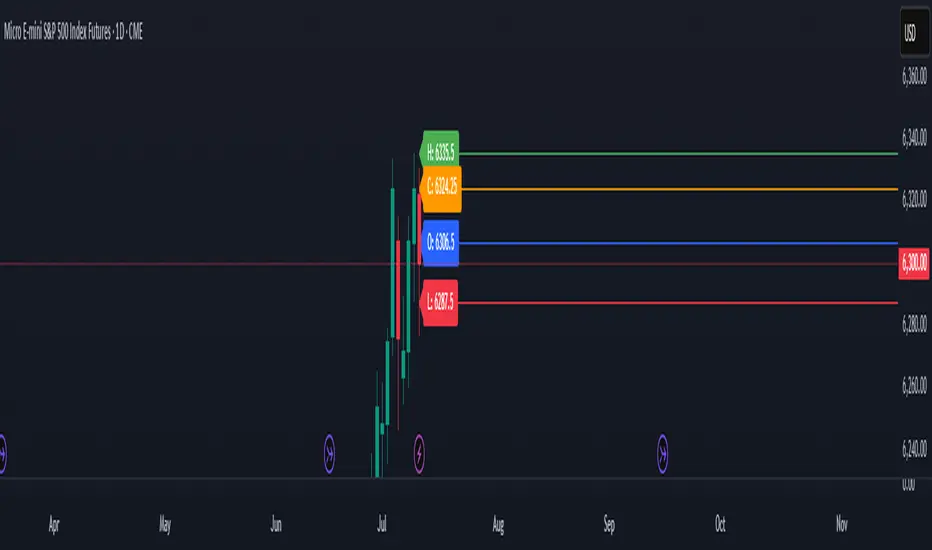
Previous Day OHLC# Previous Day OHLC Levels Indicator
## Overview
The Previous Day OHLC indicator is a simple yet powerful tool that plots the Open, High, Low, and Close levels from previous trading sessions. This indicator helps traders identify key support and resistance levels based on historical price action, making it easier to spot potential reversal zones and breakout levels.
## Key Features
### 📊 **Previous Day OHLC Levels**
- Displays the Open, High, Low, and Close prices from 1-5 days ago
- Lines automatically extend to the right for easy visualization
- Updates daily to show the most relevant levels
### 🎨 **Fully Customizable Styling**
- **Individual Line Colors**: Choose unique colors for each OHLC level
- **Line Styles**: Select from Solid, Dashed, or Dotted lines for each level
- **Line Width**: Adjust thickness from 1-4 pixels for better visibility
- **Price Labels**: Display actual price values on each line with customizable sizing
### ⚙️ **Flexible Settings**
- **Lookback Period**: Choose to display levels from 1-5 days ago (maximum safety limit)
- **Label Control**: Toggle price labels on/off and adjust their size
- **Performance Optimized**: Clean code that won't slow down your charts
## How to Use
1. **Add to Chart**: Apply the indicator to any timeframe chart
2. **Customize Settings**: Adjust colors, styles, and lookback period to your preference
3. **Identify Levels**: Use the plotted lines as potential support/resistance zones
4. **Trade Setup**: Look for price reactions at these key levels for entry/exit signals
## Best Practices
- **Day Trading**: Use 1-day lookback for intraday support/resistance
- **Swing Trading**: Extend lookback to 2-5 days for broader context
- **Multi-Timeframe**: Combine with other timeframe analysis for confirmation
- **Risk Management**: Use these levels for stop-loss and take-profit placement
## Color Coding (Default)
- **Open**: Blue - Starting price of the previous session
- **High**: Green - Highest price reached
- **Low**: Red - Lowest price reached
- **Close**: Orange - Final price of the session
## Why This Indicator Works
Previous day OHLC levels are among the most watched price points by professional traders. These levels often act as:
- **Support/Resistance**: Price tends to react at these historical levels
- **Breakout Confirmation**: Strong moves beyond these levels can signal trend continuation
- **Reversal Zones**: Price often bounces from these key levels
- **Psychological Levels**: Market participants remember these important price points
## Technical Specifications
- **Pine Script Version**: v6
- **Overlay**: Yes (plots directly on price chart)
- **Performance**: Optimized for smooth chart operation
- **Compatibility**: Works on all timeframes and instruments
Perfect for traders of all experience levels who want to incorporate previous day levels into their technical analysis toolkit!
Next Day Key Levels [Auto-Pivot Suite] RobustNext Day Key Levels
Automatically plot key levels (Floor Pivots) for the next U.S. trading day, with smart session detection.
What does this script do?
Automatically detects the most recent completed U.S. regular trading session (9:30 AM–4:00 PM Eastern) and plots all classic Floor Pivot levels for the next trading day.
Handles Mondays and holidays: Always uses the most recent session’s data, so Friday’s values are shown on Monday, and holidays are skipped seamlessly.
Works in both pre-market and after-hours—levels appear for the next session at the right time.
Levels plotted:
Previous Session High (H)
Previous Session Low (L)
Previous Session Close (C)
Pivot (P)
Resistance 1, 2, 3 (R1, R2, R3)
Support 1, 2, 3 (S1, S2, S3)
How it works
Monitors each bar and tracks session highs/lows/close only during regular market hours.
At the close of each session (4:00 PM ET), saves these values.
In pre-market (before 9:30 AM ET) and after-hours (after 4:00 PM ET), automatically plots levels based on the last completed session—always the correct session, even on Mondays and after holidays.
Why is it better?
No clutter: Only one set of levels per day, drawn cleanly.
Accurate pivots for every next U.S. session.
Zero manual setup: Add to any U.S. ticker, on any intraday timeframe.
Features
Works across all U.S. stocks and ETFs.
Plots and labels all levels with color coding for quick reference.
Designed for intraday and short-term trading strategies.
Handles time zone and market session edge cases automatically.
How to use
Add the indicator to any U.S. equity or ETF chart (15m–1h timeframes recommended).
Levels will appear automatically in pre-market or after the market closes, always for the next session.
Trade with confidence using automatic, accurate pivots and support/resistance levels.
Developed by .
For questions or feedback, leave a comment below!

Previous Highs & Lows (Customizable)Previous Highs & Lows (Customizable)
This Pine Script indicator displays horizontal lines and labels for high, low, and midpoint levels across multiple timeframes. The indicator plots levels from the following periods:
Today's session high, low, and midpoint
Yesterday's high, low, and midpoint
Current week's high, low, and midpoint
Last week's high, low, and midpoint
Last month's high, low, and midpoint
Last quarter's high, low, and midpoint
Last year's high, low, and midpoint
Features
Individual Controls: Each timeframe has separate toggles for showing/hiding high/low levels and midpoint levels.
Custom Colors: Independent color selection for lines and labels for each timeframe group.
Display Options:
Adjustable line width (1-5 pixels)
Variable label text size (tiny, small, normal, large, huge)
Configurable label offset positioning
Organization: Settings are grouped by timeframe in a logical sequence from most recent (today) to least recent (last year).
Display Logic: Lines span the current trading day only. Labels are positioned to the right of the price action. The indicator automatically removes previous drawings to prevent chart clutter.

Auto FaustAuto Faust – Intraday Market Context & Structure
Auto Faust is a visual market overlay designed for intraday traders who want fast context without relying on signals or automation. It combines classic price tools — VWAP, EMAs, RSI, Chop Score, and market structure trendlines — into a single glanceable dashboard.
🔍 What It Does:
VWAP (Volume Weighted Average Price): Shows the day's fair value price anchor.
EMAs (3, 21, 113, 200): Map short-term to long-term trend alignment. Crossovers can be used for confluence or caution.
RSI (10): Monitors local momentum. Displayed in a compact table.
Chop Score: Measures how directional price action is. High chop = ranging conditions; low = trending.
Session High/Low Tracker: Tracks the daily extremes in real-time.
Volume Monitor: Shows current candle volume, color-coded vs previous bar (green = higher, red = lower).
Dynamic Support & Resistance Lines: Plotted from pivot highs/lows (not static levels).
Automatic Trendlines: Drawn from swing structure, updating live.
📊 How to Use:
Use EMAs + VWAP alignment to assess directional bias.
Confirm clean trends with low Chop Score and RSI support.
Watch for price interaction around dynamic S/R lines and trendline breaks.
Use volume coloring to assess if momentum is increasing or fading.
No buy/sell signals are generated — this is a trader-facing tool to guide discretionary decision-making.

Initial Imbalance [First FVG - ICT] v1Initial Imbalance v1
This indicator identifies the first Fair Value Gap (FVG) at the start of a user-defined session, inspired by The Inner Circle Trader. It helps traders spot initial imbalance in a sessions price action, offering filter options to refine FVG detection and optional session high/low lines for context.
Features:
Detects the first bullish or bearish FVG at the session start (default: 08:30). ISE: Sets a custom session start time (hour and minute).
Filters FVGs by size: None, ATR-based, or Points-based.
Displays session high/low lines (optional) to visualize the session range.
Customizable colors for bullish and bearish FVGs (background and border derived from a single color input).
Alerts for new FVGs and mitigated FVGs.
Settings:
Session Start Time: Define the hour and minute for the session start.
FVG Filter Type: Choose None, ATR, or Points to filter FVGs by size.
ATR Multiple / Minimum Points: Set the minimum FVG size for ATR or Points filters.
Show Session High/Low Lines: Toggle visibility of session range lines.
Bullish/Bearish FVG Colors: Customize colors for FVGs.
Technical Details:
Overlay indicator, displayed directly on the price chart.
This indicator is ideal for traders seeking to identify key price imbalances at the start of a session, with flexible filtering and visualization options.

Autofib Extensions | DTDHello trader comuunity!
I'm introducing another script that is part of my main day-trading strategy. We all know regardless of what strategy we use, we need to know what levels offer the least amount of risk to our trade entry and a great tool to anticipate how far a move might go or what level a move may retrace to are the Fibonacci Retracement and Extensions. This indicator combines both together, but with a twist.
The main elements of the script are:
1. Multiple Session High and Lows | Developing my first script led me to understand that measuring key times during each session provides understanding of the market's continuity. I have provided 3 "sessions' a user can define according to CST time where the script saves the high and low of that session window to produce the retracement and extensions from those plots. Currently, the levels are always plotted from low to high (with the 0 mark being the high) and negative values provided so the levels are consistent. You can toggle each session on or off.
2. Coloring Key Retracements / Extensions | I use a dark background for my charts so the default colors help me distinguish from other another indicator I use. Feel free to adjust the colors to your preference. I consider 3 different colors because of their significance. Retracements that you want to see continue fall back into the .50 to .618 level (this I consider the "Golden Zone"). While basic Elliott Wave Theory states a wave is completed near the 1.618 level (this I consider "Major Extensions"). Everything isn't noise, but minor levels in a larger sequence.
______________
Script Limitations
All of my scripts are made with the help of ChatGPT so there are going to be limitations. One current one that I have made progress on, but not fully is when you are viewing a timeframe where the candle doesn't start when a session window starts. On smaller timeframes like the 7-minute this is not an issue. However, on the hourly, if your session window starts at the half hour which the 3rd session default window does, the lines will not produce. I will hopefully have this rectified in the near future. I will open the script since none of this work is original in nature and I would love to see how others can create a better product. Also, this is mainly a futures trading tool. If you are using this on stocks you will find it not as useful if the session window is too wide since the script waits until the session window closes to calculate the extension values.
Cheers,
DTD
Gold Scalping BOS & CHoCHThis strategy is designed for scalping gold (XAU/USD) on the 3-minute timeframe, utilizing Break of Structure (BOS) and Change of Character (CHoCH) to identify high-probability trade setups. Unlike traditional SMA crossover strategies, this method focuses purely on price action and market structure shifts, allowing for early entries and better risk management.
Core Concepts:
Break of Structure (BOS) – Confirms a continuation of the trend when price breaks the last swing high (bullish) or last swing low (bearish).
Change of Character (CHoCH) – Detects possible trend reversals by identifying a shift in market momentum.
Dynamic Support & Resistance – Uses the last 10-bar highs and lows to determine adaptive stop-loss (SL) and take-profit (TP) levels.
Risk-to-Reward Ratio (1:2 RR) – Ensures trades are executed with a favorable risk/reward ratio.
Entry Conditions:
Buy Entry:
BOS (Bullish) confirmed (price breaks the previous swing high).
CHoCH (Bullish) confirms trend shift.
Price crosses back above the last swing low (confirmation of support).
Sell Entry:
BOS (Bearish) confirmed (price breaks the previous swing low).
CHoCH (Bearish) confirms trend shift.
Price crosses back below the last swing high (confirmation of resistance).
Exit Conditions:
Stop Loss (SL): Set at the most recent dynamic support (for buys) or resistance (for sells).
Take Profit (TP): 2x the risk (1:2 risk-reward ratio).
Advantages of This Strategy:
✅ No lagging indicators – Uses price action for real-time entries.
✅ High probability setups – Focuses only on strong structural breaks.
✅ Adaptive SL/TP – Uses real market structure instead of fixed values.
✅ Optimized for Scalping – Best suited for quick in-and-out trades.
Best Time to Trade:
🔹 London & New York Sessions (High volatility for gold).

Negroni Opening Range StrategyStrategy Summary:
This tool can be used to help identify breakouts from a range during a time-zone of your choosing. It plots a pre-market range, an opening range, it also includes moving average levels that can be used as confluence, as well as plotting previous day SESSION highs and lows.
There are several options on how you wish to close out the trades, all described in more detail below.
Back-testing Inputs:
You define your timezone.
You define how many trades to open on any given day.
You decide to go: long only, short only, or long & short (CAREFUL: "Long & Short" can open trades that effectively closes-out existing ones, for better AND worse!)
You define between which times the strategy will open trades.
You define when it closes any open trades (preventing overnight trades, or leaving trades open into US data times!!).
This hopefully helps make back-testing reflect YOUR trading hours.
NOTE: Renko or Heikin-Ashi charts
For ALL strategies, don’t use Renko or Heikin-Ashi charts unless you know EXACTLY the implications.
Specific to my strategy, using a renko chart can make this 85-90% profitable (I wish it was!!) Although they can be useful, renko charts don’t always capture real wicks, so the renko chart may show your trade up-only but your broker (who is not using renko!!) will have likely stopped you out on a wick somewhere along the line.
NOTE: TradingView ‘Deep backtesting’
For ALL strategies, be cynical of all backtesting (e.g. repainting issues etc) as well as ‘Deep backtesting’ results.
Specific to this strategy, the default settings here SHOULD BE OK, but unfortunately at the time of writing, we can’t see on the chart what exactly ‘deep backtesting’ is calculating. In the past I have noted a number of trades that were not closed at the end of the day, despite my ‘end of day’ trade closing being enabled, so there were big winners and losers that would not have materialized otherwise. As I say, this seems ok at these settings but just always be cynical!!
Opening Range Inputs
You define a pre-market range (example: 08:00 - 09:00).
You define an opening range (example: 09:00 - 09:30).
The strategy will give an update at the close of the opening range to let you know if the opening range has broken out the pre-market range (OR Breakout), or if it has remained inside (OR Inside). The label appears at the end of the opening range NOT at the bar that ‘broke-out’.
This is just a visual cue for you, it has no bearing on what the strategy will do.
The strategy default will trade off the pre-market range, but you can untick this if you prefer to trade off the opening range.
Opening Trades:
Strategy goes long when the bar (CLOSE) crosses-over the ‘pre-market’ high (not the ‘opening range’ high); and the time is within your trading session, and you have not maxed out your number of trades for the day!
Strategy goes short when the bar (CLOSE) crosses-under the ‘pre-market’ low (not the ‘opening range low); and the time is within your trading session, and you have not maxed out your number of trades for the day!
Remember, you can untick this if you prefer to trade off the opening range instead.
NOTES:
Using momentum indicators can help (RSI and MACD): especially to trade range plays in failed breakouts, when momentum shifts… but the strategy won’t do this for you!
Using an anchored vwap at the session open can also provide nice confluence, as well as take-profit levels at the upper/lower of 3x standard deviation.
CLOSING TRADES:
You have 6 take-profit (TP) options:
1) Full TP: uses ATR Multiplier - Full TP at the ATR parameters as defined in inputs.
2) Take Partial profits: ATR Multiplier - Takes partial profits based on parameters as defined in inputs (i.e close 40% of original trade at TP1, close another 40% of original trade at TP2, then the remainder at Full TP as set in option 1.).
3) Full TP: Trailing Stop - Applies a Trailing Stop at the number of points, as defined in inputs.
4) Full TP: MA cross - Takes profit when price crosses ‘Trend MA’ as defined in inputs.
5) Scalp: Points - closes at a set number of points, as defined in inputs.
6) Full TP: PMKT Multiplier - places a SL at opposite pre-market Hi/Low (we go long at a break-out of the pre-market high, 50% would place a SL at the pre-market range mid-point; 100% would place a SL at the pre-market low)'. This takes profit at the input set in option 1).

ICT KillZones Hunt [TradingFinder] 4 Sessions + OB + FVG + Alert🔵 Introduction
🟣 ICT
The "ICT" style is a subset of "Price Action" technical analysis. The primary goal of the ICT trading strategy is to merge "Price Action" with the "Smart Money" concept to pinpoint optimal trade entry points.
However, this approach's strength extends beyond merely finding entry points. It also helps traders gain a deeper understanding of price behavior and adapt their trading strategies to the market structure.
The most important concepts of "ICT" :
Order Block
Fair Value Gap(FVG)
Liquidity
🟣 Session
Financial markets are divided into several time periods, each featuring distinct characteristics and levels of activity. These periods, known as sessions, are active at different times during the day.
The primary active sessions in financial markets include :
Asian Session
European Session
New York Session
Based on the UTC time zone, the schedule for these key sessions is :
Asian Session: 23:00 to 06:00
European Session: 07:00 to 16:30
New York Session: 13:00 to 22:00
Note
To avoid session overlap and minimize interference during kill zones, the session times have been modified as follows :
Asian Session: 23:00 to 06:00
European Session: 07:00 to 14:25
New York Session: 14:30 to 22:55
🟣 KillZone
Kill zones are periods within a session where trader activity spikes. During these times, trading volume surges, and price movements become more pronounced.
The major kill zones, according to the UTC time zone, are as follows :
Asian Kill Zone: 23:00 to 03:55
European Kill Zone: 07:00 to 09:55
New York Morning Kill Zone: 14:30 to 16:55
New York Evening Kill Zone: 19:30 to 20:55
🔵 How to Use
🟣 Order Block
Order blocks are a distinct category of "Supply and Demand" zones, formed when a series of orders are grouped together. These blocks are often created by banks or other significant market participants.
Banks typically execute large orders in blocks during their trading sessions. If they were to enter the market with small quantities, substantial price movements would occur before the orders were fully executed, reducing potential profit.
To mitigate this, they divide their orders into smaller, more manageable positions. Traders should seek "buy" opportunities in "demand order blocks" and "sell" opportunities in "supply order blocks."
🟣 Fair Value Gap (FVG)
To pinpoint the "Fair Value Gap" on the chart, meticulous candle-by-candle analysis is essential. Pay close attention to candles with significant bodies, examining each candle alongside the one preceding it.
The candles flanking this central candle should exhibit elongated shadows, with bodies that do not intersect the body of the central candle. The span between the shadows of the first and third candles is referred to as the FVG range.
Note :
The origin of all Order Blocks and FVGs starts from inside a kill zone and extends up to the end of the same session.
🟣 Kill Zone Hunt
Following this strategy, after the conclusion of the kill zone and the stabilization of its high and low lines, if the price touches either of these lines within the same session and encounters a robust rejection, it presents an opportunity to enter a trade.
🔵 Setting
🟣 Global Setting
Show All Order Block :
If it is turned off, only the last Order Block will be displayed.
Show All FVG :
If it is turned off, only the last FVG will be displayed.
Show More Info Session :
If it is turned on, more information about kill zones (Trade Volume, Time, Number of Candles) will be displayed.
🟣 Logic Parameter
Pivot Period of Order Blocks Detector :
Enter the desired pivot period to identify the Order Block.
Order Block Validity Period (Bar) :
You can specify the maximum time the Order Block remains valid based on the number of candles from the origin.
Mitigation Level Order Block :
Determining the basic level of a block order. When the price hits the basic level, the order block due to mitigation.
🟣 Order Blocks Display
Demand Order Block :
Show or not show and specify color.
Supply order Block :
Show or not show and specify color.
🟣 Order Block Refinement
Refine Demand OB :
Enable or disable the refinement feature. Mode selection.
Refine Supply OB :
Enable or disable the refinement feature. Mode selection.
🟣 FVG
FVG Validity Period (Bar) :
You can specify the maximum time the FVG remains valid based on the number of candles from the origin.
Mitigation Level FVG :
Determining the basic level of a FVG. When the price hits the basic level, the FVG due to mitigation.
Show Demand FVG :
Show or not show and specify color.
Show Supply FVG :
Show or not show and specify color.
FVG Filter :
Enable or disable filtering of FVGs. Select filter mode.
🟣 Session
Show More Info Session Color
Asia Session, London Sesseion, New York am Session & New York pm Session :
Show or not show session and kill zones. Change the display color.
🟣 Alert
Send Alert When Touched Session high & Low :
On / Off
Alert Demand OB Mitigation :
On / Off
Alert Supply OB Mitigation :
On / Off
Alert Demand FVG Mitigation :
On / Off
Alert Supply FVG Mitigation :
On / Off
Message Frequency :
This string parameter defines the announcement frequency. Choices include: "All" (activates the alert every time the function is called), "Once Per Bar" (activates the alert only on the first call within the bar), and "Once Per Bar Close" (the alert is activated only by a call at the last script execution of the real-time bar upon closing). The default setting is "Once per Bar".
Show Alert Time by Time Zone :
The date, hour, and minute you receive in alert messages can be based on any time zone you choose. For example, if you want New York time, you should enter "UTC-4". This input is set to the time zone "UTC" by default.
Display More Info :
Displays information about the price range of the order blocks (Zone Price) and the date, hour, and minute under "Display More Info". If you do not want this information to appear in the received message along with the alert, you should set it to "Off".

Market Sessions - By LeviathanA simple indicator to help you keep track of 4 market sessions (default: Tokyo, London, New York, Sydney) in 4 different visual forms (boxes, timeline, zones, colored candles) with many other useful tools.
You can choose between 4 different market sessions. The default ones are Tokyo, London, New York and Sydney but you can easily customize the times, names and colors to make the script plot any session you need. Sessions can be viewed in 4 different ways: boxes, zones, timelines, or just colored candles, all with customizable appearances. You can make your chart cleaner by merging sessions overlaps, choosing a custom lookback period and also picking between various additional settings such as viewing session High/Low or Open/Close change in % or pips, hiding weekends, viewing the Open/Close Line to identify session’s direction and 0.5 level to see session’s “Equilibrium” and much more. More updates with interesting tools will be added in the future.
Note: The script will plot the correct default Tokyo, London, New York and Sydney sessions automatically, your chart/Tradingview app timezone does not matter! If you wish to tweak the open/close times of sessions, just make sure you input them in UTC (but even this can be changed later in the settings)
Settings Overview
SESSIONS
- You can show/hide Tokyo Session, rename it, change the color and set up start/end time.
- You can show/hide London Session, rename it, change the color and set up start/end time.
- You can show/hide New York Session, rename it, change the color and set up start/end time.
- You can show/hide Sydney Session, rename it, change the color and set up start/end time.
* Keep in mind that you can fully change and customize these sessions and therefore create any other sessions or a zone you wish to display.
ADDITIONAL TOOLS AND SETTINGS
1. “Change (Pips)” - this will add the pip distance between Session High and Session Low or the pip distance between Session Open and Session Close to the session label.
2. “Change (%)” - this will add the percentage distance between Session High and Session Low or the percentage distance between Session Open and Session Close to the session label.
3. “Merge Overlaps” - this will merge the overlapping sessions and show only one at a time (end of Tokyo is moved to start of London, the end of London is moved to the start of New York, end of New York is moved to start of Sydney and end of Sydney is moved to start of Tokyo).
4. “Hide Weekends” - this will prevent the script from plotting sessions over the weekend when the markets are closed.
5. “Open/Close Line” - this will draw a line from the session open to the session close (or current price, if session is ongoing).
6. “Session 0.5 Level” - this will draw a horizontal line halfway between the session’s high and the session’s low.
7. “Color Candles” - this will color the bars/candlesticks with the color of the session in which they occurred.
8. Display Type” - Choose between three different ways of session visualization (Boxes, Zones and Candles).
9. “Lookback (Days)” - this input tells the script to only draw sessions for X days back (1 = one day).
10. “Change (%/Pips) Source) - this is where you choose the source of “Change (Pips)” and ”Change (%) ” labels. Picking “Session High/Low” will show you the change between Session High and Session Low and picking “Session Open/Close” will show you the change between Session Open and Session Close.
11. “Input Timezone” - this defines the timezone of the session start/end inputs (you don’t have to change this unless you know what you’re doing)
Make sure to read future update logs to keep track of the most recent additions and settings of this script.
Box generation code inspired by Jos(TradingCode), session box visuals inspired by @boitoki's FX Market Sessions

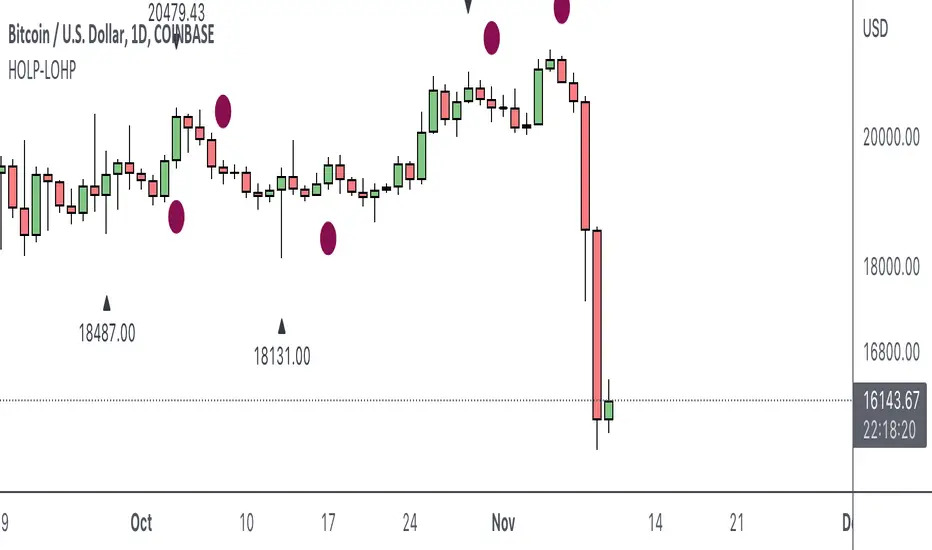
HOLP LOHP PivotCOINBASE:BTCUSD
HOLP and LOHP based on John Carter's Mastering the Trade.
HOLP stands for High Of the Low Period
LOHP stands for Low Of the High Period
This indicator is based on John Carter’s HOLP and LOHP from Mastering the Trade. The basic idea is to identify the session high and mark the low of the session high for a short entry, and vice versa for a long entry.
The default look back period is set to 10 here, albeit John Carter didn’t specify a hard coded number but rather the use of experience and common sense.
Option to turn on labels of the highs and lows of the pivots.
MM Future Session TimesThis script projects the Open/Close of the Asia, UK and US sessions highlighting the Gaps & Deadzone within the market Maker Model.
Dead Zone 5 - 8pm
Asia Gap - 8:00 - 8.30pm | Asia Open 08.30pm | Asia Close 3am
London Gap 3:00 - 3:30am | London Open 3.30am | London Close 9am
US Gap 09:00 - 9.30am | NY Open 9.30am | NY Close 5pm
Note this does not differentiate between the weekend and week day

Sessions with High/Low DiffThe main purpose of this indicator is to facilitate backtesting, but it may also be useful for traders to easily identify the current
active/open trading sessions on lower-timeframe charts.
This indicator also tracks the session high/low difference and plots it as a label on the last candle of the session once the last
bar of that session has finished printing and a new candle opened. The position and direction of the label is based on the
session open and close - if the session open is greater than the session close (which would equate to the equivalent of a red candle),
the label will be printed UNDER the last candle, and vice versa if the session close is above the session open.
The number printed inside the label is the difference between the session high and the session low, scaled to the minimum tick value of the chart.
Note #1: There is a Pinescript maximum of 500 labels allowed on any chart. While I could have gotten fancy and done some wizardry with label arrays,
I didn't really see a point to it. If labels are enabled for all 4 sessions at the same time, that would still have them available for the past 125
sessions, which would be about 6 months (approx 252 trading days per year, and this would cover 125 of them). If you limit to 2 sessions, you double
your potential look-back to almost a year (250 days out of the 252 average trading days each year), and for a single session, you double it yet again
to just under 2 years.
Note #2: As this indicator tracks open, high, low, and close for each session, it can potentially be enhanced (or forked) to construct "session candles".
I'm not sure what use this would be to anyone, but the pieces are there should someone find a use for it.
While it would be easy to add alerts on sessions opening/closing, I didn't see a purpose or value in that as it would be little more than a
glorified alarm clock. If I get enough demand to add them, I will gladly consider it.

Kviateq - Session PivotsFirst of all, I must say that this script wouldn't be possible without the help of one of the best script developers on TradingView - @ahancock (thanks a bunch for your help)
This script draws opening ranges for each of the sessions - Tokyo, London and New York and plots session high, low and pivot range of the previous session.
So if you trade London session - you would only take longs if we're above the Tokyo pivot range and vice versa for shorts.
Often times previous session's highs act as resistance and lows act as support, so careful trading around those levels.
It is obviously meant for lower timeframes, since each of the sessions only lasts a few hours.
Default settings are set to the exchange that I use and my timezone (GMT +7), so you might need to adjust the settings accordingly.
Tokyo - 12am GMT
London - 7am GMT
New York - 12pm GMT

PivotBoss Pivots & Camarilla - H,D,W, M timeframe & OHLC LabelsThis is the new pivotboss pivots calculations and also has Camarilla Pivots . User can define which time frame pivots they want to see starting from Hourly, Daily, weekly and monthly. Added labels for each levels. So that user can calculate potential profit targets. This script also includes Hourly and Daily OHLC with labels. Added Developing mid point of the current day. The script can calculate midpoint as and when new highs and lows are made through out the day
Abbrevations used in this script
yHI - Yesterday's session High
dOP - Days open
yCL - yesterday's session Close
yLO - yesterday's session Low
MP -- Developing midpoint of the day
TC - Top channel
P - Pivot Point
BC - Bottom Channel
R1 - R4 -- Resistance levels
S1 - S4 -- Support Levels


Dynamic PivotsShows various traditional pivots and hides the daily and weekly when you're watching in higher time frames. It also shows you the previous sessions highs and lows. In addition the developing pivots, high and low in the current session are also displayed.

NQ Lunch High Low First Sweep StrategyThis script identifies the FIRST liquidity sweep of the Lunch session high or low
after the Lunch session has ended, based on ICT / Killzone concepts.
Logic summary:
• Tracks Lunch session High and Low (New York time)
• After Lunch session closes, monitors the market on 5-minute timeframe
• Triggers ONLY on the first sweep:
– Price wicks beyond Lunch High and closes back below → SHORT signal
– Price wicks beyond Lunch Low and closes back above → LONG signal
• Generates an alert at the exact bar where entry is expected
• Designed specifically for Nasdaq (NQ) futures
• One trade per day – no overtrading
Notes:
• Intended for 5-minute charts only
• Uses New York session timing
• This script does NOT manage exits (TP/SL) – entry logic only
• Best used as a confluence tool, not a standalone system
Educational & discretionary use only.

Golden hour 1130 1230 Session LinesGolden Hour 11:30–12:30 Session Lines
Overview :
Calculate the session high and low between 11:30 AM and 12:30 PM and mark the lines.
Trading Rule
Once the price breaks either side (high or low), it will continue to move further in that direction.
Session Time : 11:30 AM – 12:30 PM
Key Levels : Session High & Session Low
Strategy : Breakout continuation in the direction of the break
